Eric W. Roth, NUANCE’s BioCryo EM Specialist, Co-Authors Publication in Nature Communications
The article “Improving cell-free glycoprotein synthesis by characterizing and enriching native membrane vesicles” published in Nature Communication on April 22, 2021, led by Jasmine Hershewe of the Jewett group here at Northwestern, is in part, about developing and streamlining new technologies for research and biotech, including new methods of improving the quality and method of production of membrane bound vesicles (microscopic spherical containers) produced from lysing (destroying) e. coli cells.
These vesicles are used for CFE (cell-free gene expression) and are of particular interest in the production of glycoproteins that are studied and used in immunology research, as well as in helping to manufacture and optimize vaccines. Traditional synthetic glycoprotein production results in very low yields at high cost, however “By applying our optimized methods to increase concentrations of vesicle-bound glycosylation machinery, we shorten the time associated with extract preparation, increase glycosylation efficiencies, and enhance glycoprotein titers (concentration in solution) by up to ~170%.”
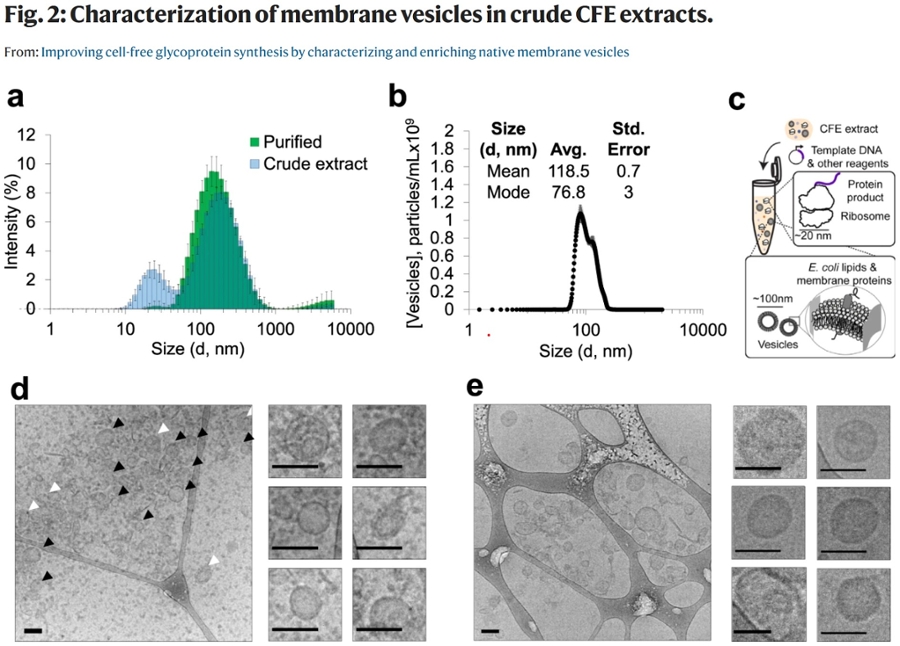
As an Electron Microscopy Specialist in NUANCE’s BioCryo Facility, Eric Roth shares: “My end of the work focused on the optimization of sample prep methods related to characterizing these vesicles, as well as the actual characterization of vesicle morphology by cryo-electron microscopy (see Figure 2) in our BioCryo facility."